Security Metrics and KPIs
- Tier: Ultimate
- Offering: GitLab.com, GitLab Self-Managed, GitLab Dedicated
The document describes the installation, configuration and user guide of the GitLab Security Metrics and KPIs Solution Component. This security solution component provides metrics and KPIs that can be viewed by business units, time range, vulnerability severity and security types. It can provide a snapshot of the security posture on a monthly or quarterly basis with PDF documents. The data is visualized using a dashboard in Splunk.
This solution exports vulnerability data from GitLab projects or groups using the GraphQL API, sends it to Splunk through the HTTP Event Collector (HEC), and includes an out-of-the-box dashboard for security metrics visualization. The export process is designed to run as a GitLab CI/CD pipeline on a scheduled basis.
Getting Started
Download the Solution Component
- Obtain the invitation code from your account team.
- Download the solution component from the solution component webstore by using your invitation code.
Set Up the Solution Component Project
- Create a new GitLab project to host this exporter.
- Copy the provided files into your project:
export_vulns.pysend_to_splunk.pyrequirements.txt.gitlab-ci.yml
- Configure the required CI/CD variables in your project settings.
- Set up a pipeline schedule (for example, daily or weekly).
How It Works
The solution consists of two main components:
A vulnerability exporter that fetches data from GitLab Security Dashboard
A Splunk ingester that processes the exported data and sends it to Splunk HEC
The pipeline runs in two stages:
extract: Fetches vulnerabilities and saves to CSVingest: Sends the vulnerability data to Splunk
Configuration
Required CI/CD Variables
| Variable | Description | Example Value |
|---|---|---|
SCOPE | Target scope for vulnerability scanning | group:security/appsec or security/my-project |
GRAPHQL_API_TOKEN | GitLab personal access token with API access | glpat-XXXXXXXXXXXXXXXX |
GRAPHQL_API_URL | GitLab GraphQL API URL | https://gitlab.com/api/graphql |
SPLUNK_HEC_TOKEN | Splunk HTTP Event Collector token | 11111111-2222-3333-4444-555555555555 |
SPLUNK_HEC_URL | Splunk HEC endpoint URL | https://splunk.company.com:8088/services/collector |
Optional CI/CD Variables
| Variable | Description | Example Value | Default |
|---|---|---|---|
SEVERITY_FILTER | Comma-separated list of severity levels | CRITICAL,HIGH,MEDIUM | All severities |
VULN_TIME_WINDOW | Time window for vulnerability collection | 24h, 7d, or all | 24h |
Scope Configuration
The SCOPE variable determines which projects or groups to scan:
- For a project:
mygroup/myproject - For a group:
group:mygroup/subgroup - For the entire instance:
instance
Severity Filter Examples
Valid severity levels:
CRITICALHIGHMEDIUMLOWUNKNOWN
Example combinations:
CRITICAL,HIGHCRITICAL,HIGH,MEDIUM- Leave empty to include all severities
Time Window Configuration
The VULN_TIME_WINDOW variable controls how far back to look for vulnerabilities:
- Format:
<number><unit>where:number: Any positive integerunit:hfor hours ordfor days
- Examples:
24h: Last 24 hours7h: Last 7 hours15d: Last 15 days30d: Last 30 daysall: All vulnerabilities (useful for first run)
Default value: 24h
Example pipeline configurations:
# For 12-hour window
variables:
  VULN_TIME_WINDOW: "12h"

# For 3-day window
variables:
  VULN_TIME_WINDOW: "3d"

# For all vulnerabilities
variables:
  VULN_TIME_WINDOW: "all"
Schedule your pipeline based on your chosen window. For example:
- For 12h: Schedule twice daily
- For 3d: Schedule every 3 days
- Add some overlap in scheduling to ensure no vulnerabilities are missed
Pipeline Setup
First Run:
- Set
VULN_TIME_WINDOW: "all"to collect all historical vulnerabilities - Run the pipeline once
- Set
Ongoing Collection:
- Set
VULN_TIME_WINDOWto your desired window (24hor7d) - Set up a pipeline schedule:
- For
24h: Schedule daily - For
7d: Schedule weekly
- For
- Set
Splunk Integration
The script sends vulnerabilities as events to Splunk.
Index Configuration
Create a new index named
gitlab_vulnsin SplunkWhen creating your HEC token:
- Set the default index to
gitlab_vulns(this index is referenced in the base search of the provided Splunk dashboard) - Ensure the token has permissions to write to this index
- Ensure that the token has a sourcetype that allows event data to be parsed correctly as JSON
- Set the default index to
Each event includes:
- Detection time
- Vulnerability title and description
- Severity level
- Scanner information
- Project details
- URLs for both project and vulnerability
Dashboard Setup
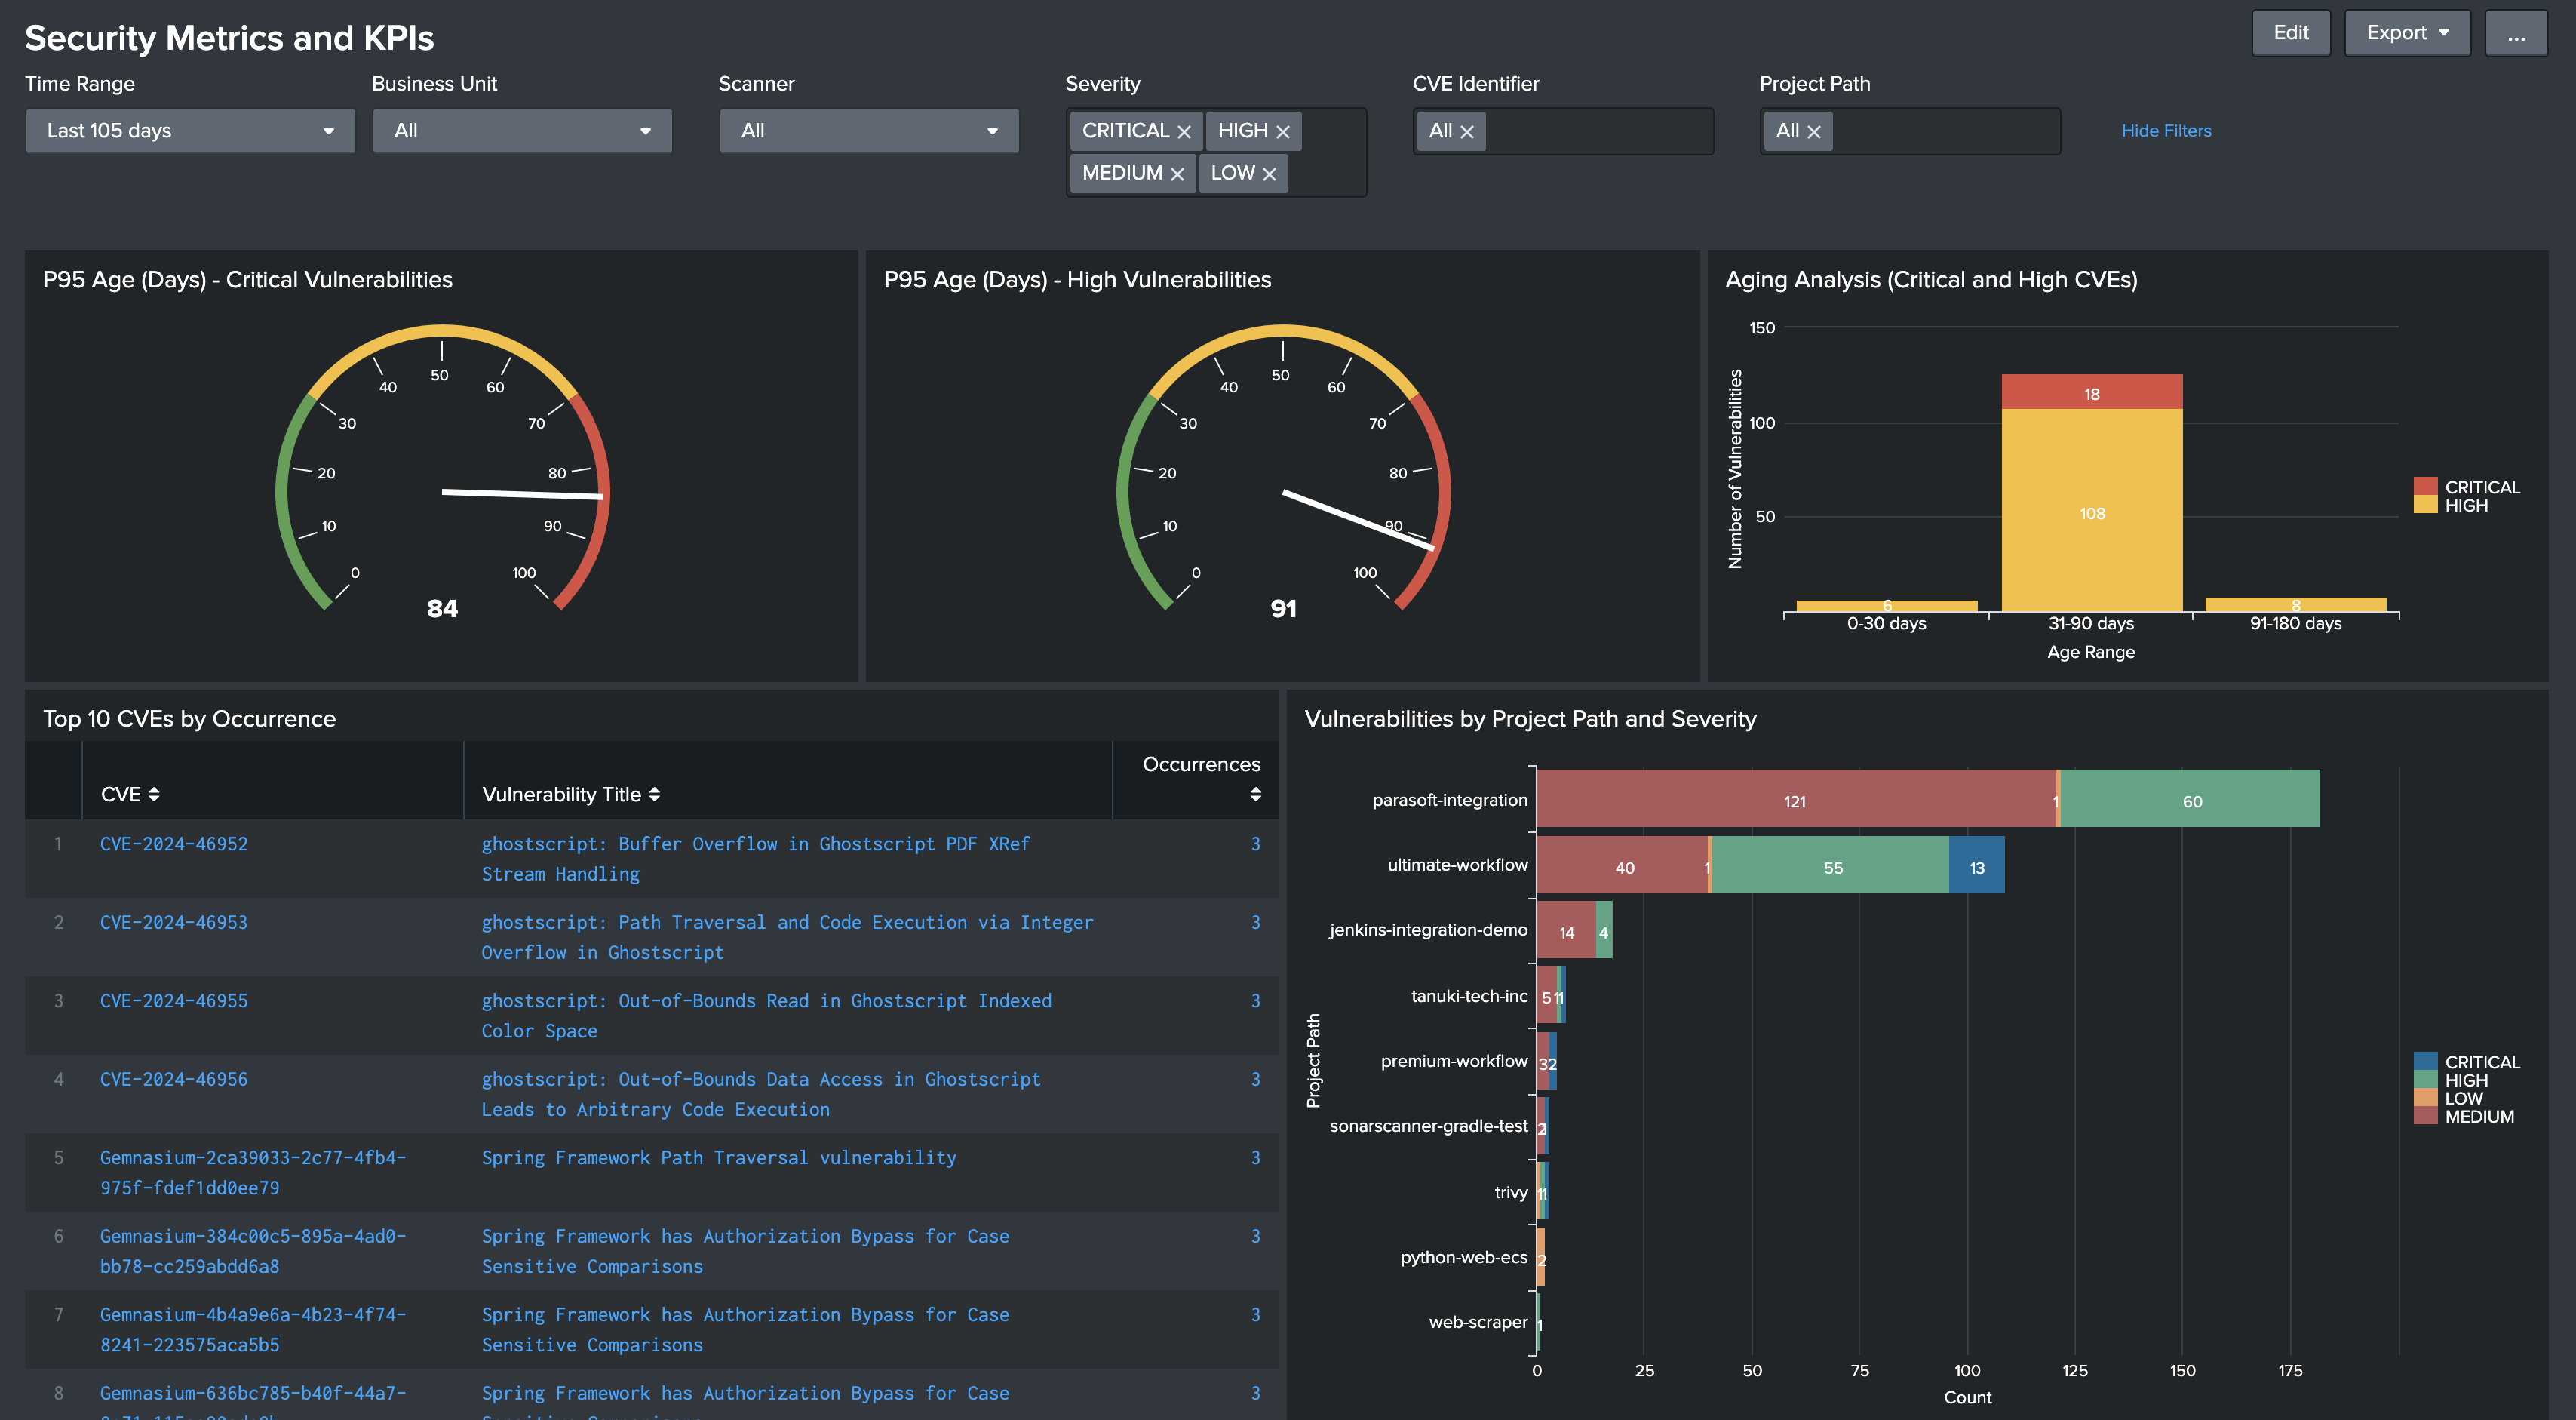
The provided dashboard offers comprehensive visibility into your GitLab vulnerability data with the following visualizations:
- P95 Age metrics for Critical and High vulnerabilities (radial gauges)
- Aging Analysis showing the distribution of Critical and High vulnerabilities across age buckets (0-30 days, 31-90 days, 91-180 days, 180+ days)
- Top 10 most frequent CVEs with their occurrence counts
- Vulnerability distribution by project path and severity
- All metrics can be filtered by business unit and time range
To set up the dashboard:
Business Unit Mapping:
Create a CSV file with two columns:
project_url,business_unitMap each GitLab project URL to its corresponding business unit.
Upload the file to Splunk as a lookup table:
- Go to Settings > Lookups > Lookup table files.
- Select New Lookup Table File.
- Upload your CSV file.
- Set the Destination filename to
business_unit_mapping.csv. - Configure permissions:
- Find the row labeled
<splunk_dir>/etc/apps/search/lookups/business_unit_mapping.csv. - Select Permissions.
- Set the permissions to either:
- Set to Global for instance-wide access.
- Share with specific apps or roles as needed.
- Select Save.
- Find the row labeled
Dashboard Installation:
- Save the provided
vuln_metrics_dashboard.xmlfile. - In Splunk:
- Go to the Search app.
- Click Dashboards > Create New Dashboard.
- Select Source in the edit view.
- Replace the default XML with the contents of
vuln_metrics_dashboard.xml. - Save the dashboard.
- Save the provided
Output Format
The intermediate CSV file contains:
detectedAt: Detection timestamptitle: Vulnerability titleseverity: Severity levelprimaryIdentifier: Vulnerability identifierexporter: Scanner nameprojectPath: GitLab project pathprojectUrl: Project URLdescription: Vulnerability descriptionwebUrl: Vulnerability details URL
Error Handling
The solution includes:
- Rate limiting handling with exponential backoff
- Batch processing for Splunk ingestion
- Proper error reporting
- Timeout handling
- UTF-8 encoding support
Best Practices
Token Permissions:
- GRAPHQL_API_TOKEN needs:
- Read access to target group/project
- Security Dashboard access
- SPLUNK_HEC_TOKEN needs:
- Event submission permissions to target index
- GRAPHQL_API_TOKEN needs:
Schedule Frequency:
- Match schedule to your
VULN_TIME_WINDOW - Include overlap to prevent missing vulnerabilities
- Consider your organization’s SLAs
- Match schedule to your
Monitoring:
- Monitor pipeline success/failure
- Track number of vulnerabilities exported
- Monitor Splunk ingestion success
Troubleshooting
Common issues and solutions:
No vulnerabilities exported:
- Verify SCOPE setting
- Check token permissions
- Verify Security Dashboard access
Splunk ingestion fails:
- Verify HEC URL and token
- Check network connectivity
- Verify index permissions