Security dashboards
- Tier: Ultimate
- Offering: GitLab.com, GitLab Self-Managed, GitLab Dedicated
GitLab 18.6 introduced an improved version of the security dashboards that use advanced vulnerability management. For details, see new security dashboards.
Vulnerability metrics in the Value Streams Dashboard
You can view vulnerability metrics also in the Value Streams Dashboard comparison panel, which helps you understand security exposure in the context of your organization’s software delivery workflows.
Security dashboards
Security dashboards are used to assess the security posture of your applications. GitLab provides you with a collection of metrics, ratings, and charts for the vulnerabilities detected by the security scanners run on your project. The security dashboard provides data such as:
- Vulnerability trends over a 30, 60, or 90-day time-frame for all projects in a group
- A letter grade rating for each project based on vulnerability severity
- The total number of vulnerabilities detected within the last 365 days including their severity
The data provided by the security dashboards can be used to supply insight on what decisions can be made to improve your security posture. For example, using the 365 day trend view, you can see on which days a significant number of vulnerabilities were introduced. Then you can examine the code changes performed on those particular days in order perform a root-cause analysis to create better policies for preventing the introduction of vulnerabilities in the future.
For an overview, see Security Dashboard - Advanced Security Testing.
Prerequisites
To view the Security Dashboards, the following is required:
- You must have the Developer role for the group or project.
- At least one security scanner configured in your project.
- A successful security scan performed on the default branch of your project.
- At least 1 detected vulnerability in the project.
The Security Dashboards show results of scans from the most recent completed pipeline on the default branch. Dashboards are updated with the result of completed pipelines run on the default branch; they do not include vulnerabilities discovered in pipelines from other un-merged branches.
Viewing the Security Dashboard
The Security Dashboard can be seen at the project, group, and the Security Center levels. Each dashboard provides a unique viewpoint of your security posture.
Project Security Dashboard
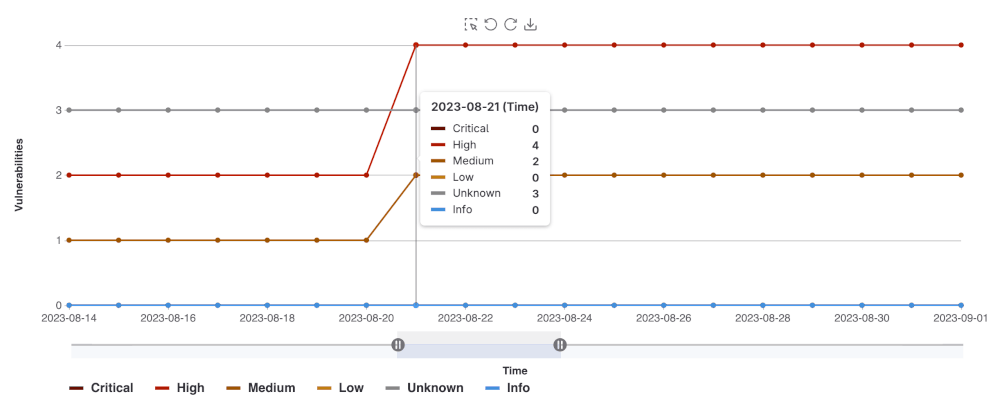
The Project Security Dashboard shows the total number of vulnerabilities detected over time,
with up to 365 days of historical data for a given project. The dashboard is a historical view of open vulnerabilities in the default branch. Open vulnerabilities are those of only Needs triage or Confirmed status (Dismissed or Resolved vulnerabilities are excluded).
To view a project’s security dashboard:
- On the top bar, select Search or go to and find your project.
- Select Secure > Security dashboard.
- Filter and search for what you need.
- To filter the chart by severity, select the legend name.
- To view a specific time frame, use the time range handles ( ).
- To view a specific area of the chart, select the left-most icon ( ) and drag across the chart.
- To reset to the original range, select Remove Selection ( ).
Downloading the vulnerability chart
You can download an image of the vulnerability chart from the Project Security Dashboard to use in documentation, presentations, and so on. To download the image of the vulnerability chart:
- On the top bar, select Search or go to and find your project.
- Select Secure > Security dashboard.
- Select Save chart as an image ( ).
You are prompted to download the image in SVG format.
Group Security Dashboard
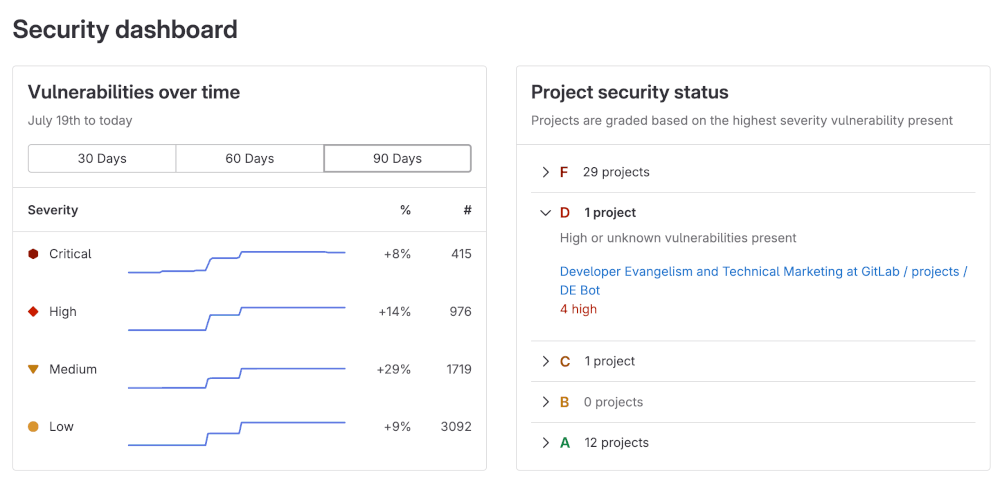
The group Security Dashboard provides an overview of vulnerabilities found in the default branches of all projects in a group and its subgroups. The Group Security Dashboard supplies the following:
- Vulnerability trends over a 30, 60, or 90-day time frame
- A letter grade for each project in the group according to its highest-severity open vulnerability. The letter grades are assigned using the following criteria:
| Grade | Description |
|---|---|
| F | One or more critical vulnerabilities |
| D | One or more high or unknown vulnerabilities |
| C | One or more medium vulnerabilities |
| B | One or more low vulnerabilities |
| A | Zero vulnerabilities |
To view group security dashboard:
On the top bar, select Search or go to and find your group.
Select Security > Security dashboard.
Hover over the Vulnerabilities over time chart to get more details about vulnerabilities.
- You can display the vulnerability trends over a 30, 60, or 90-day time frame (the default is 90 days).
- To view aggregated data beyond a 90-day time frame, use the
VulnerabilitiesCountByDayGraphQL API. GitLab retains the data for 365 days.
Select the arrows under the Project security status section to see the what projects fall under a particular letter-grade rating:
- You can see how many vulnerabilities of a particular severity are found in a project
- You can select a project’s name to directly access its project security dashboard
New security dashboards
Use security dashboards to assess the security posture of your applications. GitLab provides you with a collection of metrics, ratings, and charts for the vulnerabilities detected by the security scanners run on your project. The security dashboard provides data such as:
- Vulnerability trends over a 30, 60, or 90-day time frame for all projects in a group.
- The total number of open vulnerabilities by severity.
- The total risk score to compare vulnerability risk across projects.
Prerequisites to view the dashboard
To view the security dashboard for a project or a group you must have:
- The Developer role or higher for the group or project.
- At least one security scanner configured in your project.
- A successful security scan performed on the default branch of your project.
- At least one detected vulnerability in the project.
- Advanced vulnerability management with Advanced search enabled.
The security dashboards show results of scans from the most recently completed pipeline on the default branch. Dashboards are updated with the results of completed pipelines run on the default branch. They do not include vulnerabilities discovered in pipelines from other un-merged branches.
Viewing the security dashboard
The security dashboard shows filterable charts and panels built with data from vulnerabilities detected in the default branch. Charts include vulnerabilities over time and severity counts. The data in many charts is grouped into two categories:
- Open: Includes vulnerabilities with the Needs triage or Confirmed statuses
- Closed: Includes vulnerabilities with the Dismissed and Resolved statuses
Charts and panels include only open vulnerabilities unless otherwise noted.
You can view a security dashboard for a project or a group. Each dashboard provides a unique viewpoint into your security posture.
Both dashboards include:
To view a security dashboard:
- On the top bar, select Search or go to and find your project.
- Select Secure > Security dashboard.
Project security dashboard
The project security dashboard shows vulnerabilities detected in the project’s default branch. It includes:
- The Vulnerabilities over time chart, which includes up to 90 days of history.
- The Severity panels, which show open vulnerabilities by severity.
Open vulnerabilities are those with Needs triage or Confirmed status. Closed vulnerabilities with Dismissed or Resolved status are not included in these charts.

Group security dashboard
The group security dashboard provides an overview of vulnerabilities found in the default branches of all projects in a group and its subgroups. The group security dashboard supplies the following:
- The Vulnerabilities over time chart, which includes up to 90 days of history.
- The Severity panels, which show open vulnerabilities by severity.
- The Risk score panel, which shows total risk and risk for each project.
- The Vulnerabilities by age chart, which groups open vulnerabilities by age buckets.
Charts
Security dashboards include several charts that help you understand and act on vulnerabilities in your projects and groups.
Vulnerabilities over time
The Vulnerabilities over time chart is available on both project and group dashboards. It shows the open vulnerabilities trends over 30, 60, or 90-day periods. The default range is 30 days. GitLab retains vulnerability data for 365 days.
Use the chart to identify when vulnerabilities were introduced and how they change over time.
To view details:
- Hover over a data point to see the vulnerability count for that day.
- Use the time frame selector to switch between 30, 60, or 90 days.
- Drag the range handles ( ) to zoom in on a specific period.
- Use the dropdown to filter by Severity (for example, Critical, High, Medium)
- Use the buttons to group the data by either of the following options:
- Severity: Critical, high, medium, low, info, and unknown.
- Report type: SAST, DAST, and dependency scanning and others.
- To explore data beyond 90 days, but within the last 365 days, use the
SecurityMetrics.vulnerabilitiesOverTimeGraphQL API - Vulnerabilities that are no longer detected are not automatically counted as closed. Use vulnerability management policies to automatically close them if needed.
Starting in GitLab 18.8 (available January 2026) on GitLab.com and in GitLab 18.9 (available February 2026) on GitLab Self-Managed and GitLab Dedicated, the Vulnerabilities over time chart excludes no longer detected vulnerabilities. This approach more accurately reflects the number of detected vulnerabilities that require attention. This change might result in a drop in the total number of vulnerabilities shown in the chart. This change applies automatically to vulnerabilities no longer detected in pipelines run from GitLab 18.9 onward. A background migration handles remaining vulnerabilities from earlier pipelines.
Due to issue 590022 and issue 590018, vulnerability counts in the Vulnerabilities over time chart may not be accurate. The first issue affects dependency scanning and container scanning vulnerabilities. The second issue affects vulnerabilities that were dismissed or resolved, and then confirmed.

Vulnerability severity panel
The vulnerability severity panel shows the total number of open vulnerabilities by severity.
To view details:
- In the severity panel, locate the severity you want to investigate.
- Select View.
- The vulnerability report opens and includes only vulnerabilities of that severity.
- Any page-level filters you have set are also applied.

Risk score panel
The risk score panel shows the overall security risk for the group. The panel has two views:
- The No grouping (default) view shows the total risk score of the group:
- The circular gauge shows the calculated risk score in the center.
- The color bars indicate the risk level:
- Green: Low risk
- Yellow: Medium risk
- Orange: High risk
- Red: Critical risk
- Select Project to compare risk scores for each project:
- Each project tile is color-coded according to the project’s risk level.
- Hover over a tile to see details, including the project name and risk score.
- Select a tile and select the project’s name to open that project’s vulnerability report.


Risk scores are calculated from multiple factors, including:
- Severity of vulnerabilities
- Age of vulnerabilities
- KEV (Known Exploited Vulnerabilities) status
- EPSS (Exploit Prediction Scoring System) score
Vulnerabilities by age
The Vulnerabilities by age chart is available on group dashboards. It shows the distribution of unresolved vulnerabilities based on the amount of time since they were first detected. You can group vulnerabilities by severity or by report type, helping you identify where remediation activities may be needed.
To view details:
- Hover over a data point to see the vulnerability count for that age grouping.
- Use the dropdown list to filter by Severity (for example, Critical, High, Medium)
- Use the buttons to group the data by either of the following options:
- Severity: Critical, high, medium, low, info, and unknown.
- Report type: SAST, DAST, and dependency scanning and others.

Filter the entire dashboard
You can filter results at two levels:
- Dashboard filters: Apply to the entire dashboard. All charts update when you use these filters.
- Chart and panel filters: Apply only to the chart or panel you are viewing.
Available dashboard filters include:
- Report type: Filter by scanner, including SAST, DAST, dependency scanning, and others.
- Project: Limit results to specific projects. Available only for group security dashboards.
On the group security dashboard, you can also filter by:
- Security attributes: Filter by the security attributes applied to your projects, which include categories for business impact, application, business unit, internet exposure, and location. These filters can be inclusive (using the is one of operator) or exclusive (using the is not one of operator). To configure your security attributes and apply them to projects, see security attributes.
Dashboard filter behavior:
- Filters apply immediately across all dashboard charts and panels.
- Filters that you apply continue to apply throughout your session unless you remove them.
- When you open a vulnerability report from the dashboard, active filters are automatically applied to the vulnerability report.
To apply a filter to the whole dashboard:
- In the filter bar at the top of the dashboard, select Filter results….
- From the dropdown list, choose the filter type.
- Select one or more filter values.