Dashboards for stage groups
We generate a lot of dashboards acting as windows to the metrics we use to monitor GitLab.com. Most of our dashboards are generated from Jsonnet in the runbooks repository. Anyone can contribute to these, adding new dashboards or modifying existing ones.
When adding new dashboards for your stage groups, tagging them with
stage_group:<group name> cross-links the dashboard on other
dashboards with the same tag. You can create dashboards for stage groups
in the dashboards/stage-groups
directory. Directories can’t be nested more than one level deep.
To see a list of all the dashboards for your stage group:
- In Grafana, go to the Dashboard browser.
- To see all of the dashboards for a specific group, filter for
stage_group:<group name>.
Some generated dashboards are already available:
- Stage group dashboard: a customizable dashboard with tailored metrics per group.
- Error budget detail dashboard: a dashboard allowing to explore the error budget spend over time and over multiple SLIs.
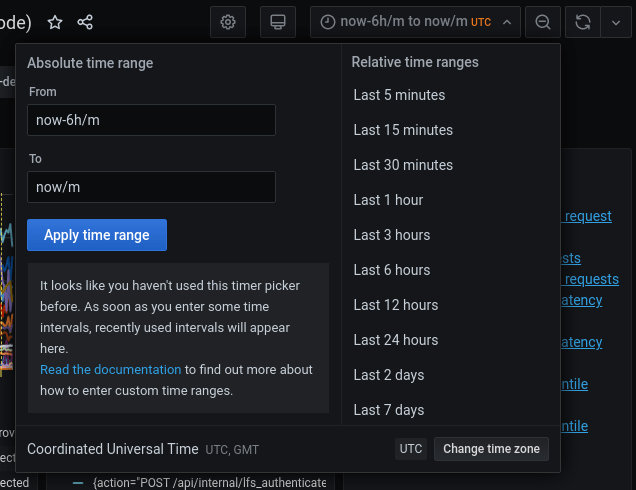
Time range controls
By default, all the times are in UTC time zone. We use UTC when communicating in Engineering.
All metrics recorded in the GitLab production system have one-year retention.
You can also zoom in and filter the time range directly on a graph. For more information, see the Grafana Time Range Controls documentation.
Filters and annotations
On each dashboard, there are two filters and some annotation switches on the top of the page.
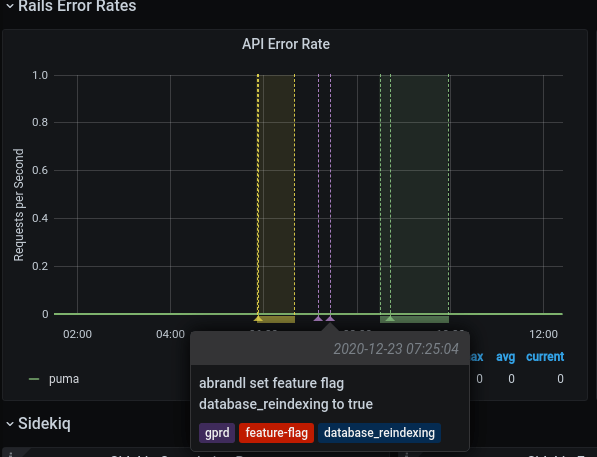
Some special events are meaningful to development and operational activities. Grafana annotations mark them directly on the graphs.
| Name | Type | Description |
|---|---|---|
PROMETHEUS_DS
| filter | Filter the selective Prometheus data sources. The default value is Global, which aggregates the data from all available data sources. Most of the time, you don’t need to care about this filter.
|
environment
| filter | Filter the environment the metrics are fetched from. The default setting is production (gprd). For other options, see Production Environment mapping.
|
stage
| filter | Filter metrics by stage: main or cny for canary. Default is main
|
deploy
| annotation | Mark a deployment event on the GitLab.com SaaS platform. |
canary-deploy
| annotation | Mark a canary deployment event on the GitLab.com SaaS platform. |
feature-flags
| annotation | Mark the time point when a feature flag is updated. |
Example of a feature flag annotation displayed on a dashboard panel:


