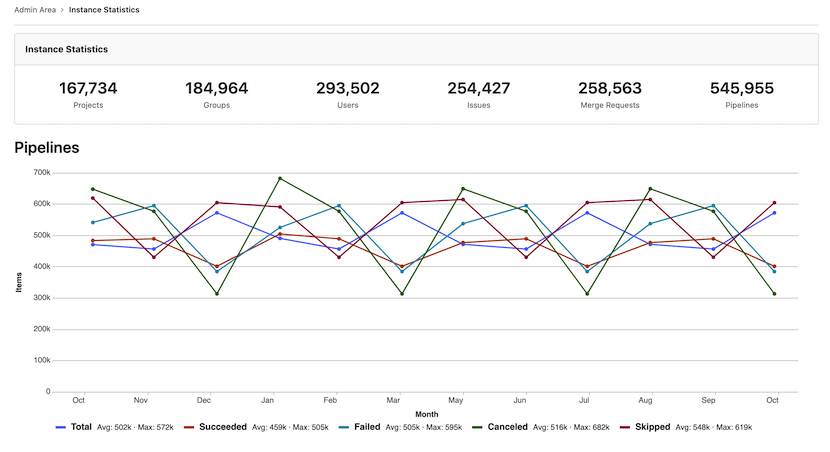
Usage trends
Usage trends give you an overview of how much data your instance contains, and how quickly this volume is changing over time. Usage trends data refreshes daily.
View usage trends
To view usage trends:
- On the left sidebar, at the bottom, select Admin.
- Select Analytics > Usage trends.
Total counts
At the top of the page, usage trends show total counts for:
- Users
- Projects
- Groups
- Issues
- Merge requests
- Pipelines
These figures can be useful for understanding how much data your instance contains in total.
Past year trend charts
Usage trends also display line charts that show total counts per month, over the past 12 months, in the categories shown in Total counts.
These charts help you visualize how rapidly these records are being created on your instance.
