- Before you begin
- Create a GitLab project
- Run the application
- Add the OpenTelemetry dependencies
- Define environment variables
- View the information in GitLab
Tutorial: Use GitLab Observability with a Java Spring application
- Observability introduced in GitLab 16.2 with a flag named
observability_features. Disabled by default.
In this tutorial, you’ll learn how to create, configure, instrument, and monitor a Java Spring application using GitLab Observability features.
Before you begin
To follow along this tutorial, you must have:
- A GitLab Ultimate subscription for GitLab.com
- A local installation of Ruby on Rails
- Basic knowledge of Git, Java Spring, and the core concepts of OpenTelemetry
Create a GitLab project
First, create a GitLab project and a corresponding access token.
- On the left sidebar, at the top, select Create new () and New project/repository.
- Select Create from template.
- Select Spring and then Use template.
- Enter the project details.
- In the Project name field, enter a name such as
test-spring-o11y
- In the Project name field, enter a name such as
- Select Create project.
- In the
test-sprint-o11yproject, on the left sidebar, select Settings > Access tokens. - Create a new access token with the Owner role and the
read_apiandwrite_observabilityscopes. Store the token value somewhere safe—you’ll need it later.
Run the application
Next, we’ll run the application to ensure that it works.
- After cloning the project from GitLab, open it in IntelliJ (or your preferred IDE).
- Open
src/main/java/com.example.demo/DemoApplicationand run the application: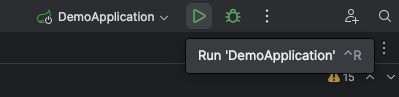
- After initialization, the application should be available at
http://localhost:8000. Test it out, then in the IDE select the Stop button.
Add the OpenTelemetry dependencies
Use auto-instrumentation to instrument the application:
-
In the
pom.xmlfile, add the required dependencies:<dependency> <groupId>io.opentelemetry</groupId> <artifactId>opentelemetry-api</artifactId> </dependency> <dependency> <groupId>io.opentelemetry</groupId> <artifactId>opentelemetry-sdk-extension-autoconfigure</artifactId> </dependency> <dependency> <groupId>io.opentelemetry</groupId> <artifactId>opentelemetry-sdk-extension-autoconfigure-spi</artifactId> </dependency><dependencyManagement> <dependencies> <dependency> <groupId>io.opentelemetry</groupId> <artifactId>opentelemetry-bom</artifactId> <version>1.40.0</version> <type>pom</type> <scope>import</scope> </dependency> </dependencies> </dependencyManagement> -
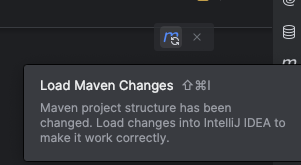
Update dependencies by selecting Update Maven Changes:
-
Download the OpenTelemetry java agent file from the OpenTelemetry repository.
curl --location --http1.0 "https://github.com/open-telemetry/opentelemetry-java-instrumentation/releases/latest/download/opentelemetry-javaagent.jar"
Define environment variables
The OpenTelemetry autoconfigure libraries read their configuration from environment variables.
-
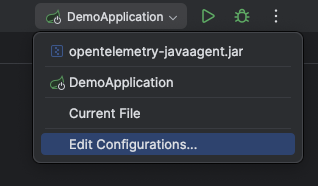
From the top-right menu, select Edit Configurations…:
-
In the configuration menu, select the icon in the Environment Variables field.
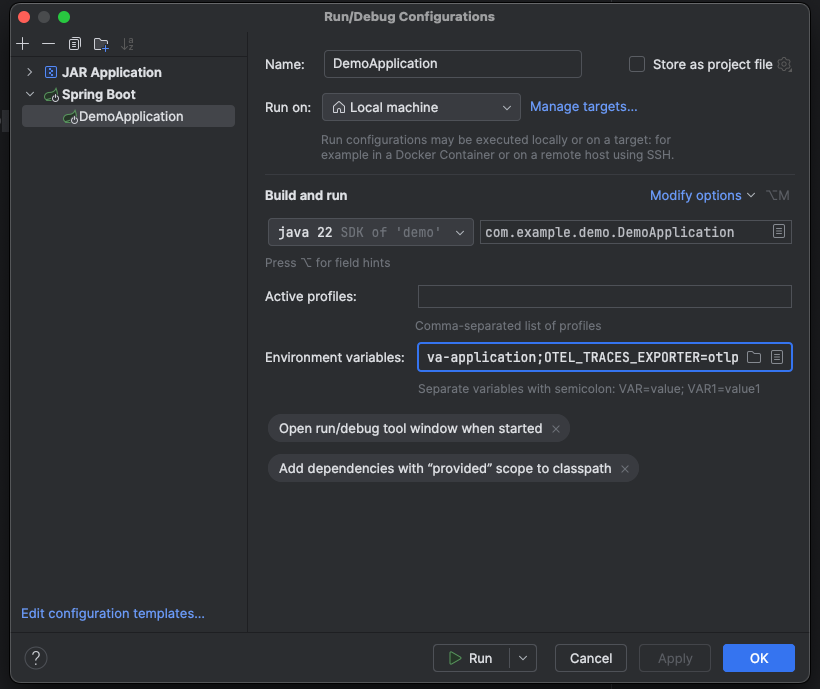
- Add the following set of environment variables, replacing
{{PATH_TO_JAVA_AGENT}},{{NAMESPACE_ID}},{{PROJECT_ID}},{{PROJECT_ACCESS_TOKEN}}and{{SERVICE_NAME}}with the correct values.JAVA_TOOL_OPTIONS=-javaagent:{{PATH_TO_JAVA_AGENT}}/opentelemetry-javaagent.jarOTEL_EXPORTER_OTLP_ENDPOINT=https://observe.gitlab.com/v3/{{NAMESPACE_ID}}/{{PROJECT_ID}}/ingestOTEL_EXPORTER_OTLP_HEADERS=PRIVATE-TOKEN\={{PROJECT_ACCESS_TOKEN}}OTEL_LOGS_EXPORTER=otlpOTEL_METRIC_EXPORT_INTERVAL=15000OTEL_METRICS_EXPORTER=otlpOTEL_SERVICE_NAME=example-java-applicationOTEL_TRACES_EXPORTER=otlp
- Restart the application and reload the page at
http://localhost:8000a few times.
View the information in GitLab
To view the exported information from your test project:
- On the left sidebar, select Search or go to and find your project.
- Select Monitor, then either Logs, Metrics, or Traces.