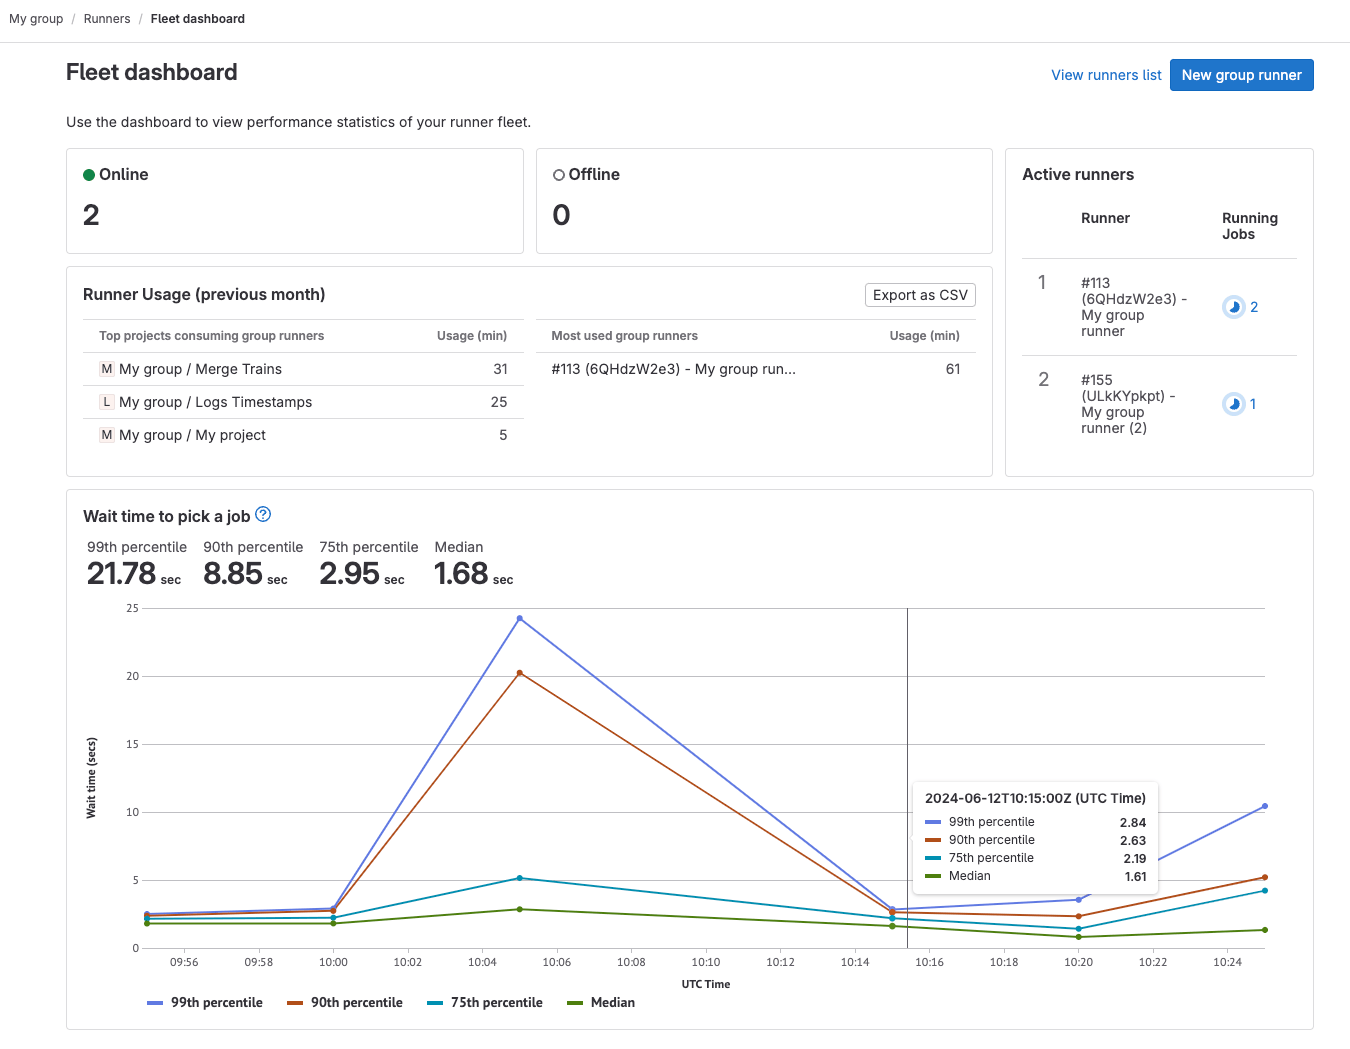
Runner fleet dashboard for groups
Tier: Ultimate
Offering: GitLab.com, Self-managed
Status: Beta
History
-
Introduced as a beta in GitLab 17.0 with a flag named
runners_dashboard_for_groups. Disabled by default. - Feature flag
runners_dashboard_for_groupsremoved in GitLab 17.2.
Users with at least the Maintainer role for a group can use the runner fleet dashboard to assess the health of group runners.
Dashboard metrics
The following metrics are available in the runner fleet dashboard:
| Metric | Description |
|---|---|
| Online | Number of online runners. In the Admin area, this metric displays the number of runners for the entire instance. In a group, this metric displays the number of runners for the group and its subgroups. |
| Offline | Number of offline runners. |
| Active runners | Number of active runners. |
| Runner usage (previous month) | Number of compute minutes used by each project on group runners. Includes the option to export as CSV for cost analysis. |
| Wait time to pick a job | Displays the mean wait time for runners. This metric provides insights into whether the runners are capable of servicing the CI/CD job queue in your organization’s target service-level objectives. The data that creates this metric widget is updated every 24 hours. |
View the runner fleet dashboard for groups
Prerequisites:
- You must have the Maintainer role for the group.
To view the runner fleet dashboard for groups:
- On the left sidebar, select Search or go to and find your group.
- Select Build > Runners.
- Select Fleet dashboard.
For self-managed GitLab instances, most of the dashboard metrics work without any additional configuration. To use the Runner usage and Wait time to pick a job metrics, you must configure the ClickHouse analytics database.
